About This Launch
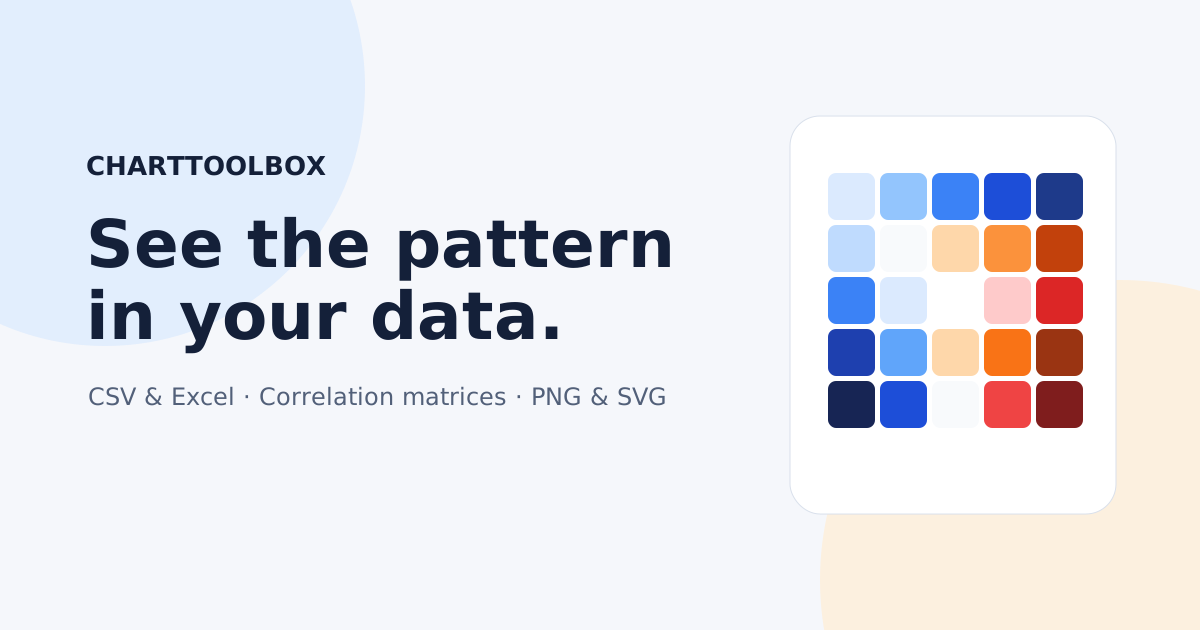
Make bar, line, pie, scatter, histogram, heatmap, and correlation charts in your browser. Paste data or upload a spreadsheet, then export SVG or PNG. Nothing leaves your device. No account, no server upload.
Screenshots
Why I Built This
I kept needing a clean chart from a spreadsheet without signing up for another SaaS or uploading private data. Charttoolbox runs the whole chart pipeline in the browser so the file never leaves the machine.
Launch Details
CategoryProductivity
StageLive
ListedOctober 11, 2026